
Do you want to maximize your debugging skills with chrome dev tools & using the keyword debug in your editor? This blog fills your expectation with examples.
Firstly we have to be aware of what type of debugging methods and tools are available for all of us.
Pre-requisites:
Tools:
Most of the developers can use different browsers to connect with the world. The major tools are listed here, and now we are going to look at how to handle debugging with Google Chrome in this blog.
- Chrome
- Visual Studio IDE,
- Firefox
- Edge
- Opera
- Safari
We have 3 methods of debugging our source code, before going to these methods you should follow these steps to save your time with the dealing of bugs.
- Firstly analyze the entire code that you have written
- Then try to split your major issues into small sections
- Again read your code step by step and try to find the scope of the bug
- Then follow the debugging methods to find your bug and fix it
Method 1: Using console.log()
Debugging is the process of finding bugs and fixing them. The initial method of finding bugs and understanding the reason for an issue and fixing it is using the console.log method. This method is simple for fewer lines of code, but when it comes to bigger applications it has become a headbanger for the developer.
Let us see a simple calculator application and analyze the debugging process in every method.
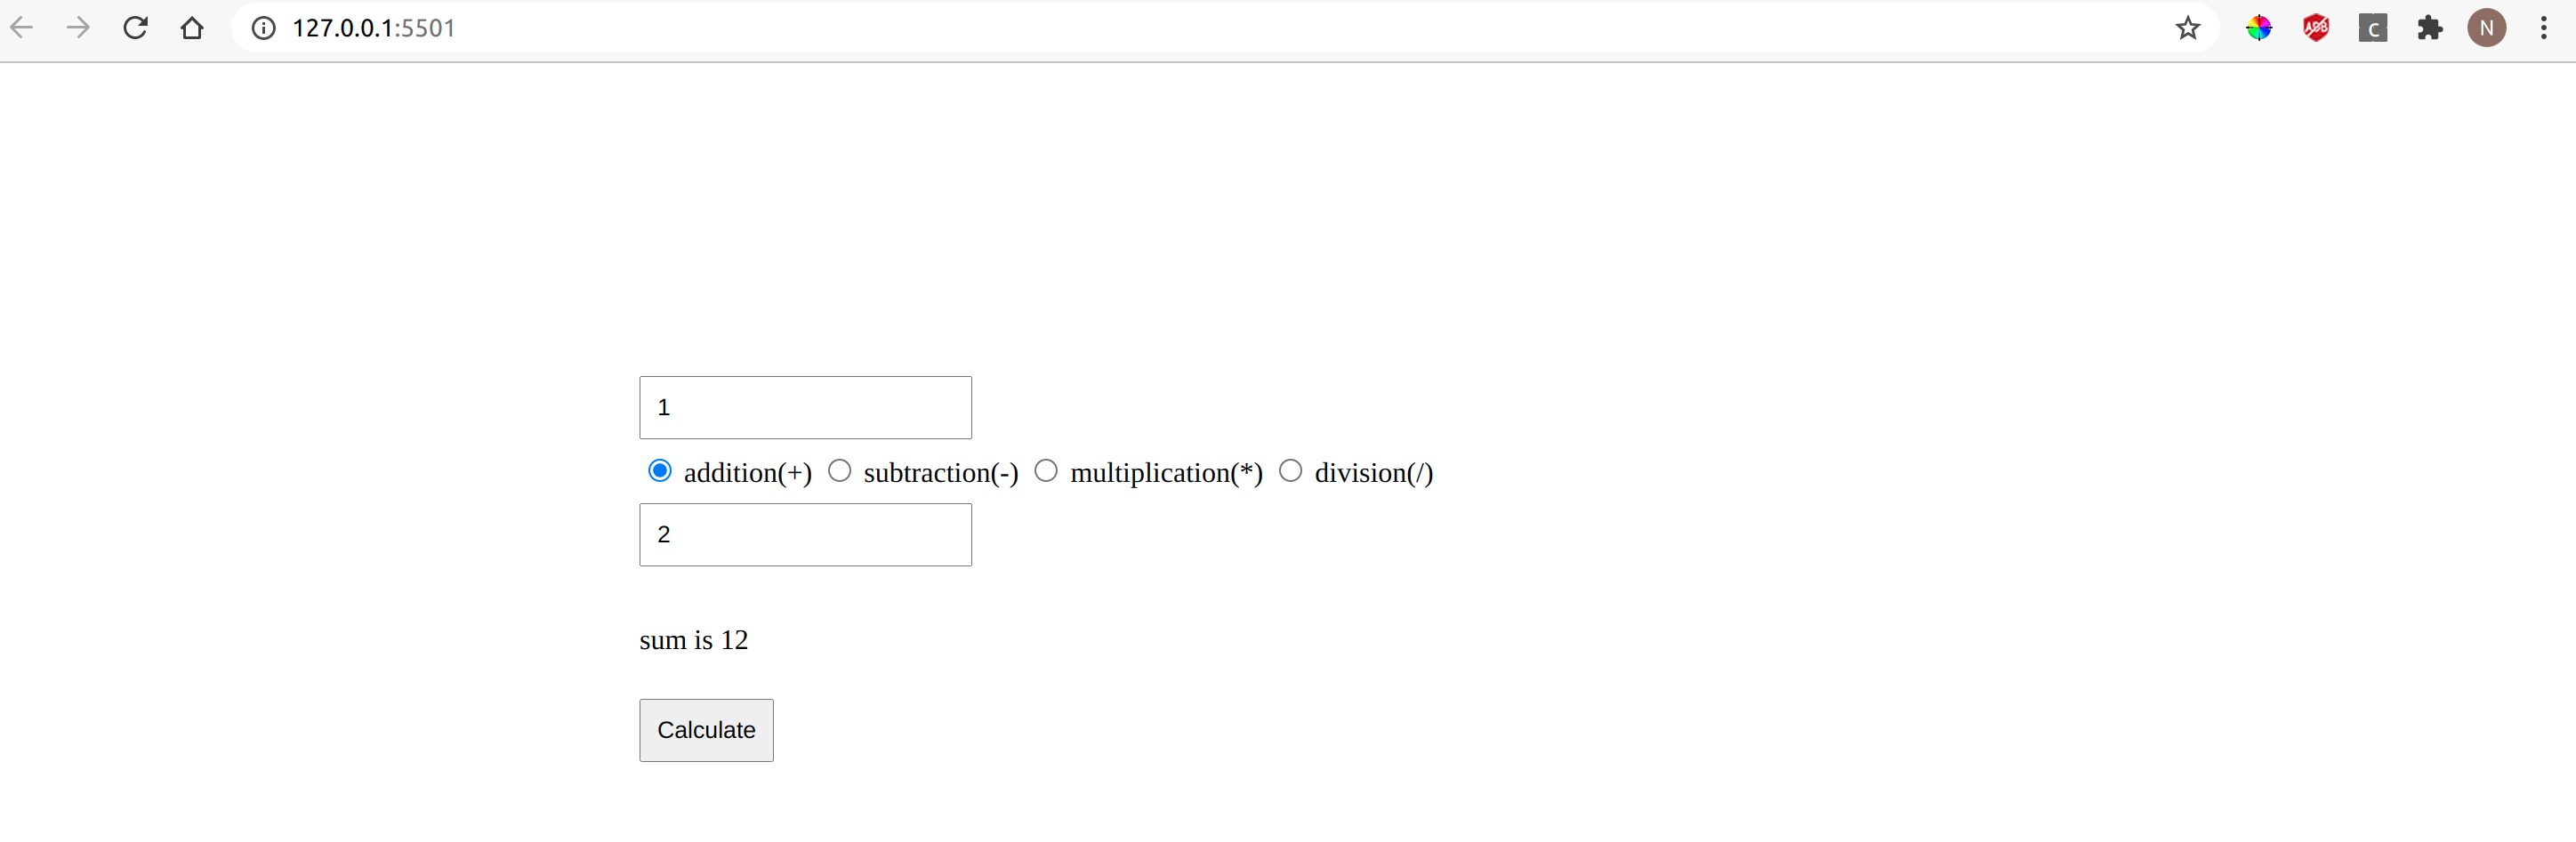
In the above results, we got 1+2 = 12, instead of 3. So here is the bug, that we are not getting the required outcome. Let us go to our code and read the entire code again and write console.log in a few places to know the scope of a bug.
Here is my source code for the calculator application https://github.com/kosarajunavya/kosarajunavya.github.io/tree/main/Jstasks/task1
Js code here
function sum() {

      var a =$("#firstNumber").val();

      console.log(a);

      var b =$("#secondNumber").val();

      console.log(b);

      var sum = a + b;

      console.log(sum);

      $("#ans").html("sum is " + sum);

      }
See the results in the console

Try to find out the bug here, and the problem is, in javascript if you want to add numbers then you have to parse them otherwise the js considers the numbers as strings. So the operator that we have used here is +. This operator adds the numerical and concatenates the string. So, to perform additional operations we have to parse them or use the number function to compute the actual numerical.
//modified code
function sum() {

       var a =parseInt($("#firstNumber").val());

       console.log(a);

       var b =parseInt($("#secondNumber").val());

       console.log(b);

       var sum = a + b;

       console.log(sum);

       $("#ans").html("sum is " + sum);

       }
Now verify the results in your application.

And the bug is fixed and we got the expected results. The disadvantage of this method is that we have to read every line of the code and have to include a huge number of console.log(), to find the value and to analyze the scope of the bug. This could definitely beat the clock. Here is a solution for this, look down for the next interesting method.
Method 2: Using Breakpoints
- One of the effective and comfortable ways of debugging is using the breakpoints in the respective browser. Here are the steps to handle the breakpoints in Chrome.
- Know your breakpoints by analyzing the scope of the bug. In this case, the bug that we found is, in our calculator application instead of summing the numerical they are getting concatenated.
- So the issue was raised on the computation part of the code so set a breakpoint near the function and run your code there you find the bug that you missed to parse the numerical.
- So go to your code and update that part
Step 1: Open developer tools
Go to your browser and open your console by hitting f12 in windows/Linux, cmd J in mac.

Step 2: Go to sources

Step 3: select js file

Step 4: Enable breakpoints
Firstly know your breakpoint for the respective source code that you want to debug, in this source code we have an issue with the computation part. To enable a breakpoint where the computation part is happening. As per the requirement, you can give as many as breakpoints to understand the flow of our source code.
 Step 5: Observe the functionality
Now, this breakpoint is gonna hit when the calculate button is fired off, so give the two inputs and click the calculate button. Now see what happens.
Step 6: Observe the results
Now the debugger pauses the code at a given breakpoint and observes the flow of code by hitting f10(which helps us to go to the next line of the code).
![Analysing results as per the breakpoints instructions]()
Step 7: Know your mistake

Now observe the results, here we can see the results clearly where the functionality is going wrong in the scope section, like the results of the variables.
Step 8: Correct your code
Now go to your code and correct the bug.
//modified code
function sum() {

 var a =parseInt($("#firstNumber").val());

 var b =parseInt($("#secondNumber").val());

 var sum = a + b;

 $("#ans").html("sum is " + sum);

 }
Finally, go to your console again and enable the breakpoint of your modified code, then again give the inputs and check the results.

Perfect! you got the expected results. So, with flexible steps, we can resolve our issues with the help of breakpoints.
Method 3: Using Debugger keyword
Great! you came till here, Good to see you.
Here is another cool method of debugging. So in this method, you need to do only one step. Just write the debugger keyword in your source code, that's all! very simple right.
//modified code
 function sum() {

     var a =$("#firstNumber").val();

     var b =$("#secondNumber").val();

     var sum = a + b;

     debugger;

     $("#ans").html("sum is " + sum);

     }
Now go to browser, open console, provide input values, hit the calculate button. Now you can see the debugger is enabled and paused the code along with results.

So you will get the scope of the bug then go to your code editor, fix the bug. Again cross-check your results.
Conclusion :
Debugging is the basic skill that every developer should have, so habituate debugging your code at a beginner level. I have given a clear explanation of doing debugging. So go on and get started on doing experiments with the debugger.
Thank you so much for reading🤗! Hope you learned something from this article, I am happy of getting your experience of using a debugger🙌!
FAQ
What is debugging?
Debugging is the process of detecting bugs in a software code and resolving them to avoid the crash of the application.
Can I use a debugger keyword in the browser directly?
Yes, of course, you can use it. In the part of the source section, you have an edit feature, so you can select the area of the code where you want to debug and write the debugger keyword there and save it then perform the action the debugger will be enabled when that particular action happens.
Is there any other method of debugging other than these 3 methods?
Yes, you can also debug your source code by using a terminal in vscode with the node.js package.
How to decide my Breakpoints?
Firstly analyze your code functionality, then track your source code in which area your source is misleading and that point is your breakpoint. When you are clear about your requirement then finding breakpoints is very simple.

Comments